

Bore Welder Return on Investment Calculator Results Explained

A bore welder return on investment calculator turns your production, labor, shift, inflation, tax, and benefit assumptions into an estimate of financial return. Read the payback period as total costs divided by total annual savings. The result is only as reliable as its inputs, so review each assumption before relying on the estimate.
It’s easy to focus on the final ROI figure, but that number can hide what drives the result. Production gains, staffing costs, working hours, and tax treatment all affect the calculation. Set measurable benefits, such as reduced labor costs, alongside less direct gains, such as more consistent work or lower exposure to welding fumes.
This guide explains how to read the main outputs and trace them back to your inputs. You’ll see how production and staffing estimates interact with shifts, inflation, and taxes, and how to weigh measurable savings against operational benefits that are harder to express in dollars. Use that breakdown to judge whether the estimate reflects your work, rather than treating one headline number as the whole decision.
Table of Contents
Calculator inputs for production and staffing
Production and staffing inputs connect expected output with labor costs. Enter current operating figures first, then compare them with the projected process.
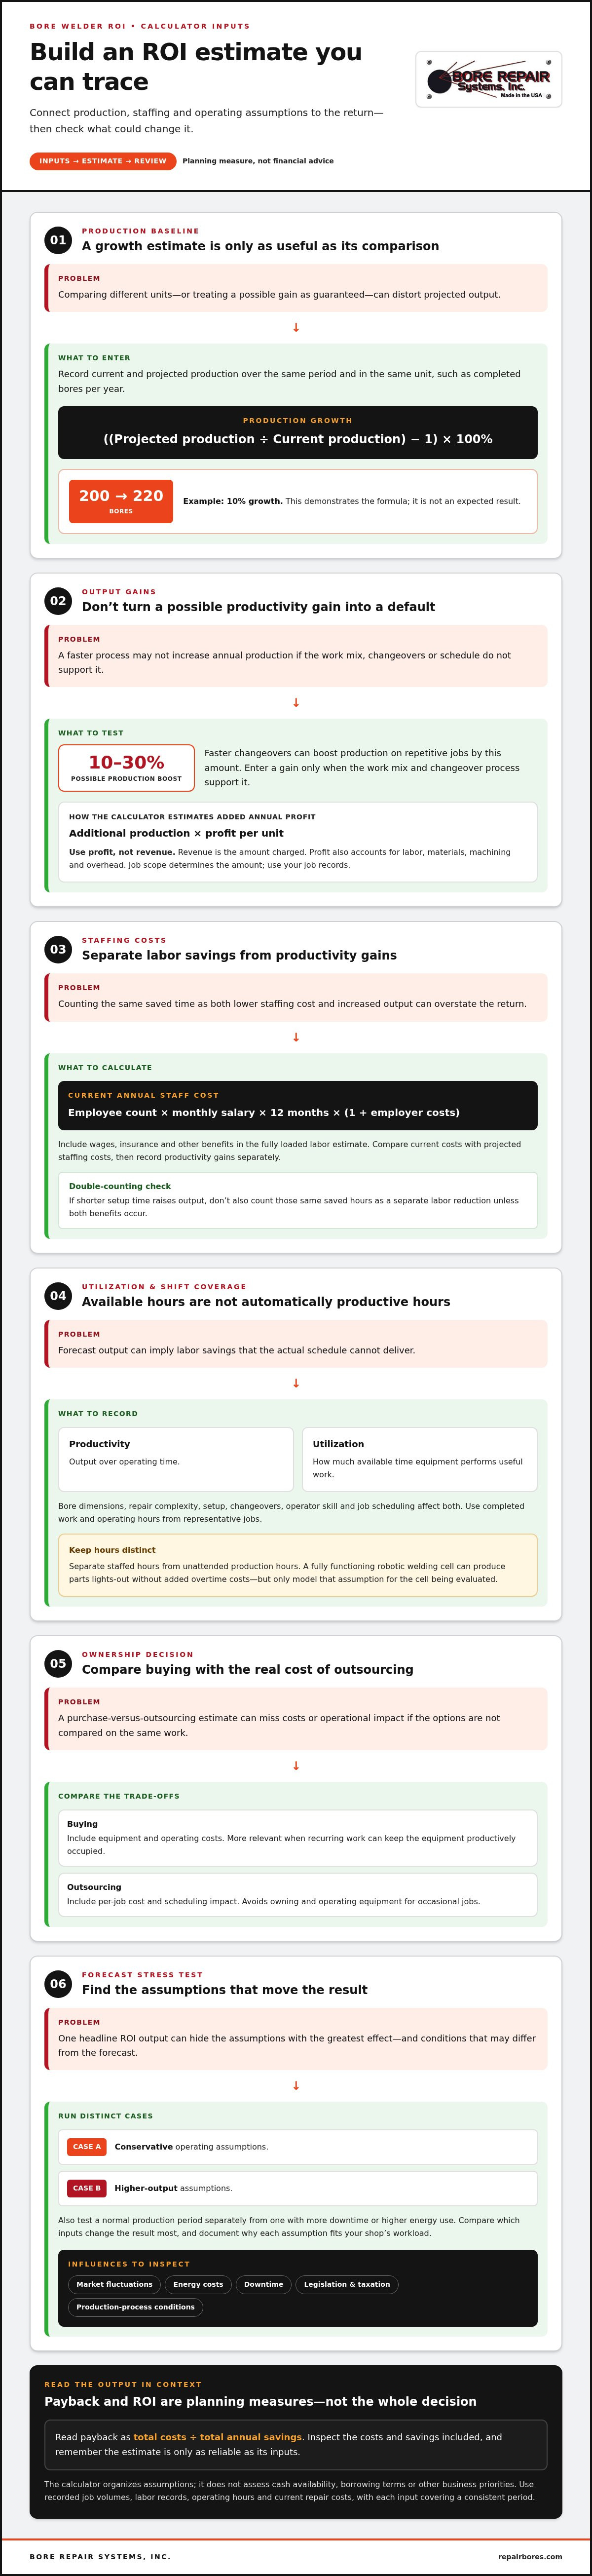
Production growth means the percentage increase between projected output and current output. Calculate it as projected production divided by current production, minus one, multiplied by 100%. Faster changeovers can boost production on repetitive jobs by 10-30%. Enter that gain only when the work mix and changeover process support it.
Use the same unit for both production figures, such as completed bores per year. If current output is 200 bores and projected output is 220, the formula shows a 10% increase. This example illustrates the calculation, not an expected result. A calculator uses additional production multiplied by profit per unit to estimate additional annual profit.
Typical revenue or profit per bore welding job depends on the job scope, not a universal rate. Revenue is the amount charged; profit also accounts for labor, materials, machining, and overhead. Use your job records to avoid treating revenue as profit.
Buying versus outsourcing compares equipment and operating costs with the per-job cost and scheduling impact of outsourced repairs. Buying is more relevant when recurring work can keep the equipment productively occupied; outsourcing avoids owning and operating equipment for occasional jobs.
Labour Savings and Productivity Gains
Labour savings are the reduction in staffing costs associated with the production method being evaluated. Calculate current annual staff costs by multiplying employee count, monthly salary, 12 months, and one plus employer costs. Include wages, insurance, and other benefits in the fully loaded labor estimate. Compare that figure with projected staffing costs, then record productivity gains separately to prevent counting the same benefit twice.
Productivity and Utilization Factors
Productivity measures output over operating time, while utilization tracks how much available time the equipment performs useful work. Bore dimensions, repair complexity, setup, changeovers, operator skill, and job scheduling all affect those measures. Record completed work and operating hours from representative jobs, then use those figures for the forecast. For a practical equipment reference, review bore welder equipment details against the tasks in your estimate.
Shift coverage determines the hours available for production. A fully functioning robotic welding cell can produce parts lights-out without added overtime costs, but that assumption applies to the cell being modeled. Separate staffed hours from unattended production hours so projected output does not imply labor savings the schedule cannot deliver.
ROI estimates and financial advice disclaimer
An ROI estimate compares projected savings and gains with purchase and operating costs. Treat it as a planning tool, not financial advice, and inspect its assumptions before making a capital decision. A bore welder return on investment calculator organizes those assumptions, but your business must decide how they fit its financial plans.
Estimated ROI Limitations
Estimated ROI limitations are factors that can cause a forecast to differ from operating results. The calculator identifies market fluctuations, energy costs, downtime, changes in legislation and taxation, and production-process conditions as influences.
Test the estimate under different operating conditions. For example, model a normal production period separately from one with more downtime or higher energy use. Efficiency gains also depend on how consistently the process runs. A single output should not obscure which assumption has the greatest effect.
Keep the calculation separate from financial advice. It organizes inputs and shows how they relate; it doesn’t assess cash availability, borrowing terms, or other business priorities. Use the ROI output alongside your own financial review.
ROI Input Estimates
ROI input estimates are the operating and financial assumptions used to calculate projected return. Start with recorded job volumes, labor records, operating hours, and current repair costs. Enter each input over a consistent period.
Use a fully loaded hourly labor cost that includes wages and benefits. Separate direct savings from increased production revenue, and avoid counting an efficiency improvement twice. For example, if shorter setup time raises output, don’t also count the same saved hours as a separate labor reduction unless both benefits occur.
Run a conservative case and a higher-output case. Compare which inputs change the result most, then document why each assumption fits your shop’s workload. A bore welder return on investment calculator is more useful when its estimates reflect recorded conditions, not unsupported targets.
Purchase Price
Purchase price is the acquisition cost entered for the bore welder and included equipment. There is no typical figure that applies to every setup: the configuration and what the purchase includes determine the amount.
Use the actual quoted purchase amount for the equipment you are considering. Keep optional accessories and related setup expenses visible as separate line items to see what drives the total investment. Don’t substitute a general industry figure for a specific equipment proposal.
Compare the same scope in your estimate and purchasing decision. If the investment period includes additional annual costs, record them separately rather than folding them into the initial amount.
Ongoing Ownership Costs
Ongoing ownership costs are expenses required to operate and maintain equipment over the investment period. Include maintenance, welding consumables, and operator training as separate categories.
Estimate maintenance based on planned service work and operating conditions. Base consumables on the materials and job volume in your forecast. Training costs should reflect the people who need to operate or program the equipment, since skills affect workflow and efficiency.
Record when each expense occurs and whether it changes with production. This helps distinguish recurring costs from one-time training or setup. For a project-specific discussion of your assumptions, discuss your ROI inputs.
Inflation, tax, and long-term projections
Long-term projections show how future costs and after-tax profit affect a return estimate. Review inflation, tax, and investment duration as separate inputs before comparing results.
Inflation
Inflation is a change in the prices of goods and services over time. In a projection, it affects the future purchasing power of savings and the cost of operating processes. Consider which expenses may change, such as energy, consumables, or maintenance. Apply the calculator’s inflation assumption consistently to future costs and benefits, rather than adjusting only one side of the estimate.
Compare an inflation-adjusted view with one that holds inputs constant. The difference shows how sensitive the result is to rising expenses or changing savings. Keep assumptions visible. If a robotic process reduces labor but changes energy use, account for both effects rather than treating increased output as the only long-term change.
Tax
Net profit after tax is total profit minus the tax amount. The calculator estimates this by subtracting tax from total profit. Keep pre-tax profit and tax as distinct entries so the final figure clearly reflects the calculation.
Tax assumptions affect projected net profit and therefore the return shown. Use the tax input that applies to your financial model, and keep it consistent across the investment period. Don’t treat pre-tax profit as spendable savings. The calculator organizes the inputs; a financial professional can address how tax treatment applies to your business.
Long-Term Projections
Investment period is the span of time used to compare the initial investment with projected costs and returns. A longer period includes more annual costs and potential savings, so it can change the outcome even when yearly production remains constant.
The calculator estimates total investment cost by adding the initial cost to additional annual costs multiplied by the investment period. Include recurring expenses for each year modeled. Then compare the total with savings and profit across that same period. Inconsistent time spans can make a projected return appear stronger or weaker than it is.
The calculator’s annual rate of return expression is (√(1 + total ROI) - 1) × 100%, with n representing the investment period. Use the investment period consistently when interpreting this annualized result. It offers a yearly perspective on total ROI, while payback period considers how annual savings relate to costs.
Reviewing the Estimate
Scenario analysis compares results under different assumptions. Change one input at a time, such as inflation, tax, or the investment period, and record how the result shifts. This identifies which assumptions have the most influence.
Keep operating costs and savings within the same period.
Separate after-tax profit from pre-tax profit.
Review annual costs alongside the initial investment.
Document each assumption so future updates remain consistent.
These steps make long-term results easier to trace. A clear model helps decision-makers see whether projected savings remain meaningful after recurring costs, inflation, and tax are included.
Shifts, hours, and working weeks
Shift inputs translate available operating time into projected annual production. Enter hours and working days that match the schedule being modeled.
Annual Production
Annual production after robotisation is the estimated output across robot operating hours and working days. Calculate it by multiplying robot production per hour by robot hours and working days. Keep the production unit consistent, such as completed bores per hour and completed bores per year.
Use operating records to set the hourly production rate, then match the hours input to the actual schedule. Don’t count all scheduled time as productive if setup, job changes, or downtime reduce output. The estimate should reflect the process being evaluated, not an ideal shift without interruptions.
Shift Hours
Shift hours are the hours allocated to production during each shift. Enter the hours the machine can perform useful work, not simply the full span between shift start and finish. This prevents breaks, changeovers, and planned stoppages from inflating annual output.
For a multi-shift schedule, calculate operating hours from the shifts that will actually use the equipment. Separate staffed operating time from unattended time. A fully functioning robotic welding cell can produce parts lights-out without added overtime costs, but include those hours only when the cell and production process support that operation.
Working Days
Working days are the days included in the annual production forecast. Use your operation’s calendar rather than assuming every weekday is a production day. Maintenance closures, holidays, seasonal demand, and scheduled shutdowns affect the days available for output.
Keep the working-days input aligned with the selected shift schedule. If the forecast includes a weekend shift, include those operating days in the calculation. If production stops during a planned closure, exclude those days. Consistent assumptions make the annual estimate easier to compare with current production records.
Schedule and Payback
Schedule utilization is the share of planned operating time spent producing useful work. Compare the calculator’s projected hours with job logs, downtime records, and the shift plan. This reveals gaps between equipment availability and actual production time.
Payback depends on annual savings, so schedule assumptions affect how quickly projected benefits accumulate. Test the forecast using the normal shift pattern and a reduced-hours scenario. Review production and savings together: automation cannot create annual output during hours when no suitable work is scheduled.
Tangible and intangible ROI benefits
Tangible benefits are operational gains measurable in dollars, time, or completed work. Intangible benefits improve work quality or conditions but may not translate directly into immediate savings. Separate the two categories in your ROI model so the financial estimate remains traceable while broader operational value stays visible.
Tangible Benefits
A fixture table can reduce welding setup time by 30-50% and rework by 20-40%. Those changes can affect labor hours, throughput, and material use. Use shop records to estimate your current setup and rework costs, then compare them with the expected process. Keep setup savings distinct from additional production revenue to avoid counting one benefit twice.
Modular fixtures can reduce setup changes for varying part sizes. That matters when a shop handles different workpieces, because less time spent changing setups can leave more time for productive welding. Track setup duration and rework separately. Moderate-volume welding shops may recoup fixture table costs in 6-12 months, depending on complexity.
Intangible Benefits
Intangible benefits are improvements that matter operationally but lack a direct, immediate dollar value. Guided positioning can help less-skilled welders produce more uniform results. Greater consistency may support quality control and reduce variation between operators, even when a calculator cannot assign those gains a reliable financial value.
Collaborative robots can help decrease welders’ exposure to toxic fumes. Record this as an operational benefit rather than converting it into an unsupported dollar saving. Documenting best practices also helps team members follow a consistent approach. Together, these factors can strengthen process repeatability without overstating the calculator’s financial result.
Putting Benefits Into the Estimate
Benefit tracking links each claimed improvement to a measurable indicator. For setup, record time per changeover; for rework, track repaired or repeated work; for consistency, review inspection findings. Compare measures before and after the process change, using the same definitions and work categories.
Limit financial entries to benefits you can connect to real costs or output. List quality, consistency, and exposure improvements separately, then explain how each supports the operation. This keeps the ROI estimate easier to audit and prevents less tangible benefits from inflating projected savings.
If you’re evaluating how operator capability affects these benefits, discuss bore repair training needs and how they fit your workflow.
Bore Repair Systems, Inc. - Bore Repair Made Easy with our USA made Lineboring and Boreweld solutions: Bore Welders
Bore Repair Systems, Inc. - Bore Repair Made Easy with our USA made Lineboring and Boreweld solutions offers Bore Welders for teams evaluating in-house bore repair. Compare equipment needs with projected job volume, staffing plans, and expected use before deciding whether ownership fits your operation.
Line Boring Machines and Bore Repair Accessories can also support the equipment setup you are assessing. If operator capability is part of your ROI assumptions, line boring and bore welding training services can help build the skills needed for consistent processes. Match equipment and training to the work your team expects to perform, then use those requirements to refine the calculator inputs.
For help considering equipment and training alongside your bore repair plans, contact Bore Repair Systems.
Turn the Estimate Into an Operating Plan
Use your bore welder return on investment calculator results as a starting point for a practical equipment plan. Next, match the assumptions with the repair work your team expects to handle, the skills available in-house, and the equipment needed to support that workflow.
Bore Repair Systems, Inc. - Bore Repair Made Easy with our USA made Lineboring and Boreweld solutions offers Bore Welders, Line Boring Machines, and line boring and bore welding training services. These options can help connect an ROI model with the equipment and operator development relevant to your repair process. Focus on the work you want to bring in-house and the capabilities your team needs to perform it.
Bring your projected workload and operating assumptions into the next conversation. Discuss your bore repair equipment and training needs with Bore Repair Systems, Inc. - Bore Repair Made Easy with our USA made Lineboring and Boreweld solutions. A clear plan gives your ROI estimate a useful next step.
Frequently Asked Questions
How to interpret the results of the ROI calculator?
Read the result as a comparison between projected financial gains and the investment, then identify which inputs drive it. Separate money saved from additional revenue, and compare each assumption with completed job records. For example, if the result changes sharply when expected job volume changes, workload is a key decision factor. Keep a copy of the inputs so you can later compare the forecast with operating results.
When Can You Expect a Return?
Payback occurs when accumulated net savings cover the investment and associated costs. Timing depends on the number of suitable jobs completed, their contribution after operating costs, and how regularly the equipment is used. A steady stream of repair work can build cumulative savings differently from occasional jobs. Use job schedules and production records to turn the calculator’s period estimate into an operating milestone.
How many hours of labor can a bore welder save per repair?
There isn’t one labor-savings figure that applies to every repair. Compare labor hours for a specific repair method with the hours required using the bore welder. Include preparation, setup, operation, and finishing in both totals. Count hands-on labor separately from machine cycle time, since a machine operating does not automatically mean an employee’s time is saved. Repeat the comparison across similar repair types.
How many bore welding jobs are needed to break even on a machine?
Divide the total investment by the net contribution from each bore welding job to estimate the break-even job count. Net contribution is the value retained per job after variable labor, consumables, and other operating costs, not gross revenue. If job types vary, calculate the contribution for each type and use the expected work mix. This shows how workload and job economics combine to recover the investment.
Comments